
What is secondary ion time-of-flight mass spectrometry (ToF-SIMS)
Secondary ion time-of-flight mass spectrometry (ToF-SIMS) is an extremely sensitive surface analysis method that uses a pulsed ion beam (Cs or microfocused Ga) to remove molecules from the outermost surface of the sample. The particles are removed from mono-atomic layers on the surface (secondary ions). These particles are then accelerated into a flight tube while their mass is precisely determined by accurately measuring the time it takes for them to reach the detector (i.e. time-of-flight). Three operating modes are applied in ToF-SIMS: surface mass spectrometry, surface imaging, and depth profiling. The analytical capabilities of ToF-SIMS include:
Mass resolution of 0.00x amu. Particles with the same nominal mass (e.g., Si and C2H4, both have a mass = 28) are easily distinguishable from each other because Mr. Einstein predicts a small mass shift when atoms transition to a bonded state.
Mass resolution of 0-10,000 amu; can detect ions (positive or negative), isotopes, and molecular compounds (including polymers, organic compounds, and up to ~amino acids).
Element detection limits in the range.
Element detection limits in the ppm range.
Depth profiling capability; surface sputtering allows for chemical stratigraphic analysis on the material surface (typical sputtering rate is ~100 A/minute).
Retrospective analysis. Each pixel of the ToF-SIMS map represents a complete mass spectrum. This allows an analyst to retrospectively produce maps for any mass of interest, and to define regions of interest (ROI) regarding their chemical composition through computer processing after the dataset has been collected by the tool.
The fundamentals of time-of-flight secondary ion mass spectrometry measurement
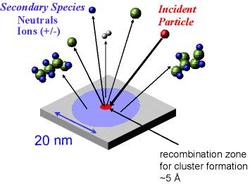
ToF-SIMS uses a focused, pulsed beam of particles (typically Cs or Ga) to eject chemical species from the surface of the material. Particles generated closer to the impact site tend to be dissociated into ions (positive or negative). Secondary particles generated further from the impact site tend to be molecular compounds, typically fragments of much larger organic macromolecules. The particles are then accelerated into a flight path towards a detector. Since it is possible to measure the "time of flight" of particles from the moment of impact to detection on the nanosecond scale, mass resolution as small as 0.00X atomic mass units (i.e., a thousandth of the mass of a proton) can be achieved. Under typical operating conditions, ToF-SIMS analysis results include:
A mass spectrum surveying all masses in the range of 0-10,000 amu,
A scattered beam generating maps of any mass of interest on a sub-micron scale
Depth profiles created by removing surface layers through ion beam sputtering.
ToF-SIMS is also known as "static" SIMS because a low primary ion beam is used to "sputter" the sample surface to release ions, molecules, and molecular clusters for analysis. In contrast, "dynamic" SIMS is the method of choice for quantitative analysis because the higher primary ion beam leads to faster sputtering rates and generates much higher ion yields. Therefore, dynamic SIMS produces better counting statistics for trace elements. Organic compounds are effectively destroyed by "dynamic" SIMS and no diagnostic information is obtained.
Secondary ion mass spectrometry (ToF-SIMS) - How does it work?
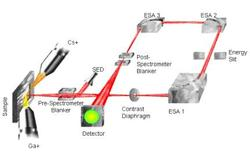
Schematic of the Charles Evans TRIFT ToF-SIMS instrument. ToF-SIMS instruments typically include the following components:
A ultra-high vacuum system, necessary to increase the mean free path of the ions released along the ion flight path.
A particle gun, typically using a Ga or Cs source;
The path of the ions is designed in a circular manner, where an electrostatic analyzer is used to focus the ion beam (the figure below shows the design of the Charles Evans TRIFT), or linear using reflective mirrors (see more about the design of the "reflective mirror" of Cameca's IonTOF system);
A mass detection system.
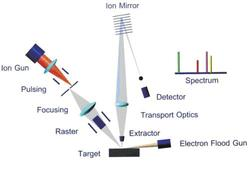
Schematic of the CAMECA IonTOF ToF-SIMS instrument. ToF-SIMS instruments are also equipped with a powerful computer and software to control and analyze the system. One of the main features of the ToF-SIMS software is the ability to perform "retrace" analysis, meaning that each molecule from the sample detected by the system can be stored by the computer as a function of its mass and its origin point. This allows users to obtain chemical mapping or spectra of specific areas that were not previously identified after the original data has been collected.
Applications
ToF-SIMS is widely used in the materials science fields in studies of materials such as polymers, pharmaceuticals, and semiconductors. There are three main data collection methods including:
Elemental / molecular survey;
Elemental / molecular mapping;
Depth profiling.
In principle, ToF-SIMS is applicable to any surface-mediated processes such as: catalysis, adsorption, redox, and dissolution/precipitation reactions. Only recently has ToF-SIMS been applied to geological materials. Some examples:
Organic films at mineral grain boundaries
Identification of organic biomarkers in rock profiles
Characterization of organic macromolecules in coal mines
Analysis of metals precipitated from magma fluids in seafloor hydrothermal systems
Analysis of interplanetary dust particles
What are the strengths and limitations of Time-of-Flight Secondary Ion Mass Spectrometry (ToF-SIMS)?
Strengths:
- Surveying all masses on the surface of materials; they can include individual ions (positive or negative), individual isotopes, and molecular compounds;
- Mapping elements and chemistry at sub-micrometer scales;
- High mass resolution, to distinguish species with similar nominal masses (mass resolution of at least 0.00x amu);
- High sensitivity to trace elements or compounds, on the order of ppm to ppb for most species;
- Surface analysis of insulating and conductive samples;
- Depth profiling (in the near-surface environment, on the order of individual atomic layers up to 10s of nanometers);
- Non-destructive analysis;
- Retrospective analysis, to analyze after data collection and interpret the stored images and spectra.
Limitations:
- Generally does not produce quantitative analyses (best as semi-quantitative);
- Optical capabilities are often limited, making it difficult to find particles or specific areas of interest for analysis;
- Charging can be an issue in some samples, although the charge compensation process is generally sufficient to address these issues;
- There is often a change in images when switching from positive ion data collection mode to negative; this complicates the collection of both positive and negative ion data at the same location;
- Too much data; the benefit of retrospective analysis is also its curse. Each pixel of the image generated by ToF-SIMS also contains the entire mass spectrum for that point. Therefore, it can take hours, days, or weeks to fully analyze a dataset. Thus, it is extremely important to have a very clear purpose in collecting ToF-SIMS data and to focus on analyzing and interpreting data specifically relevant to the current question.
User Guide - Sample Collection and Preparation
ToF-SIMS is extremely sensitive to any sample preparation method: there are often residues related to any sample pre-treatment process and there is always "unexpected" (or environmental) contamination in the form of compounds absorbed on the material's surface from the air. Generally, we try to analyze the sample "as received." Solid materials (such as mineral grains) are often pressed into an Indium foil, which is both flexible and conductive. Any mapping of the sample before it is placed in the sample chamber will significantly increase the ability to locate and identify areas of interest. The first step of the analytical process, we usually will "dust off" the surface with a very light sputtering time (<1 minute) to try to clean any surface contamination that has been absorbed.
Data collection, results
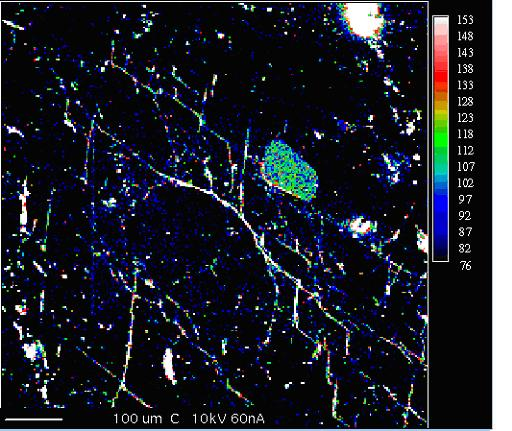
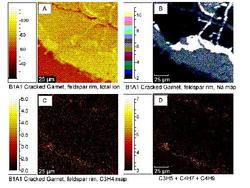
An example of a ToF-SIMS elemental mapping of a bi-polar garnet from the deep drilling hole KTB, Germany. A carbon bonding network can be seen at the grain boundaries and cutting traces. From Mogk and Mathez (2000).
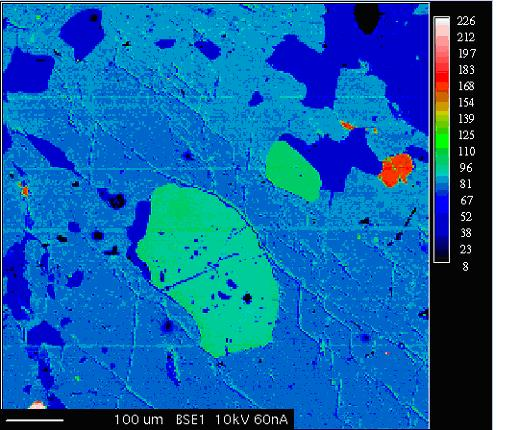
Backscattered electron image of amphibolite garnet. Note the garnet is green; hornblende is light blue.
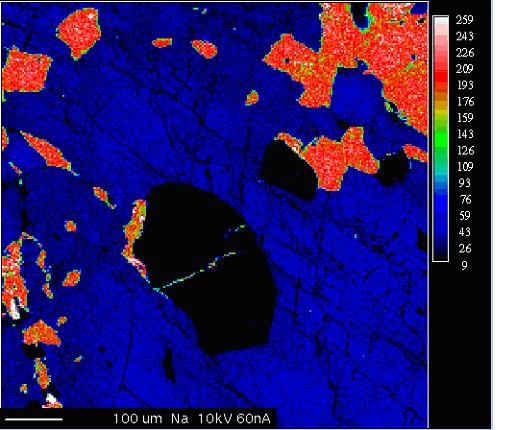
Na graph. Note Na in the crack on the garnet.
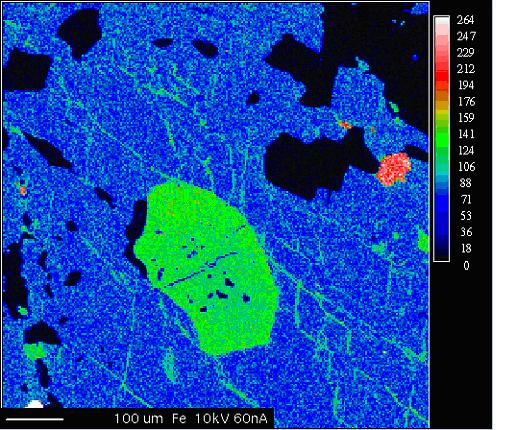
Note the Fe enrichment in the cuts in the kerogen.