
“Asbestos” is not a single chemical entity but rather the name of a group of six naturally occurring hydrated fibrous polysilicates that include small and ultrafine fibers. Previously, asbestos was primarily used as a building material, which led to its dispersion in the air, soil, and water. Asbestos fibers were found to be extremely toxic in the first half of the 20th century, and their use has been banned in Europe and the United States since the late 1980s to early 1990s.

Figure 1 – Asbestos
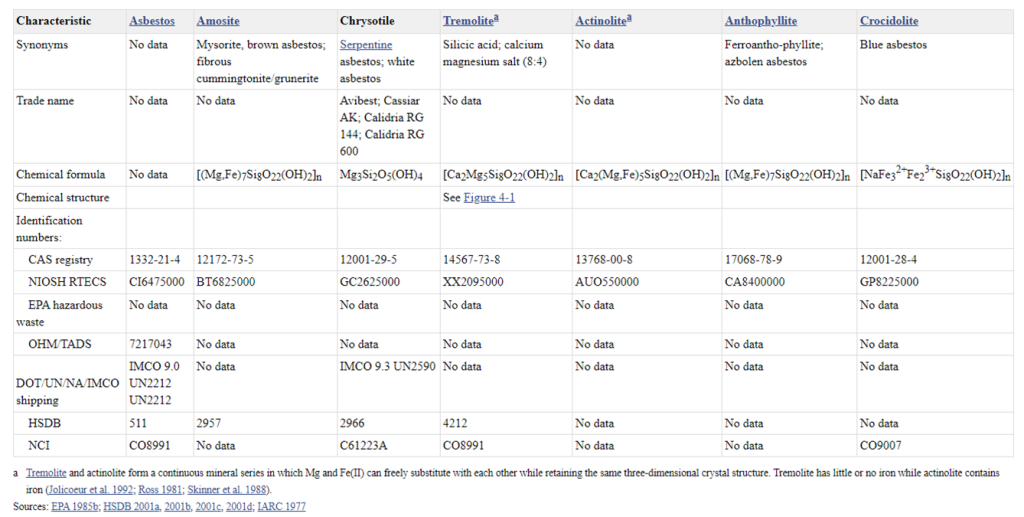
Figure 2 – Chemical composition of asbestos (Asbestos Toxicity Profile, Atlanta (GA): Agency for Toxic Substances and Disease Registry (USA); September 2001).
Because the toxicity of asbestos appears to be primarily related to fiber size, modern analytical methods focus on providing information about these parameters, as well as the total number of fibers and the type of mineral. Currently, the quantity and size distribution of fibers in a sample can only be determined by direct examination using a microscope. This can be done using either optical microscopy or electron microscopy.
Although optical microscopy has been used longer than electron microscopy, optical microscopy can provide much more in-depth information about the presence, composition, and quality of asbestos fibers in a sample.
Desktop scanning electron microscopy (TT-SEM) with integrated elemental analysis can easily detect asbestos fibers in a sample and identify the type of mineral using energy-dispersive X-ray spectroscopy (EDS).
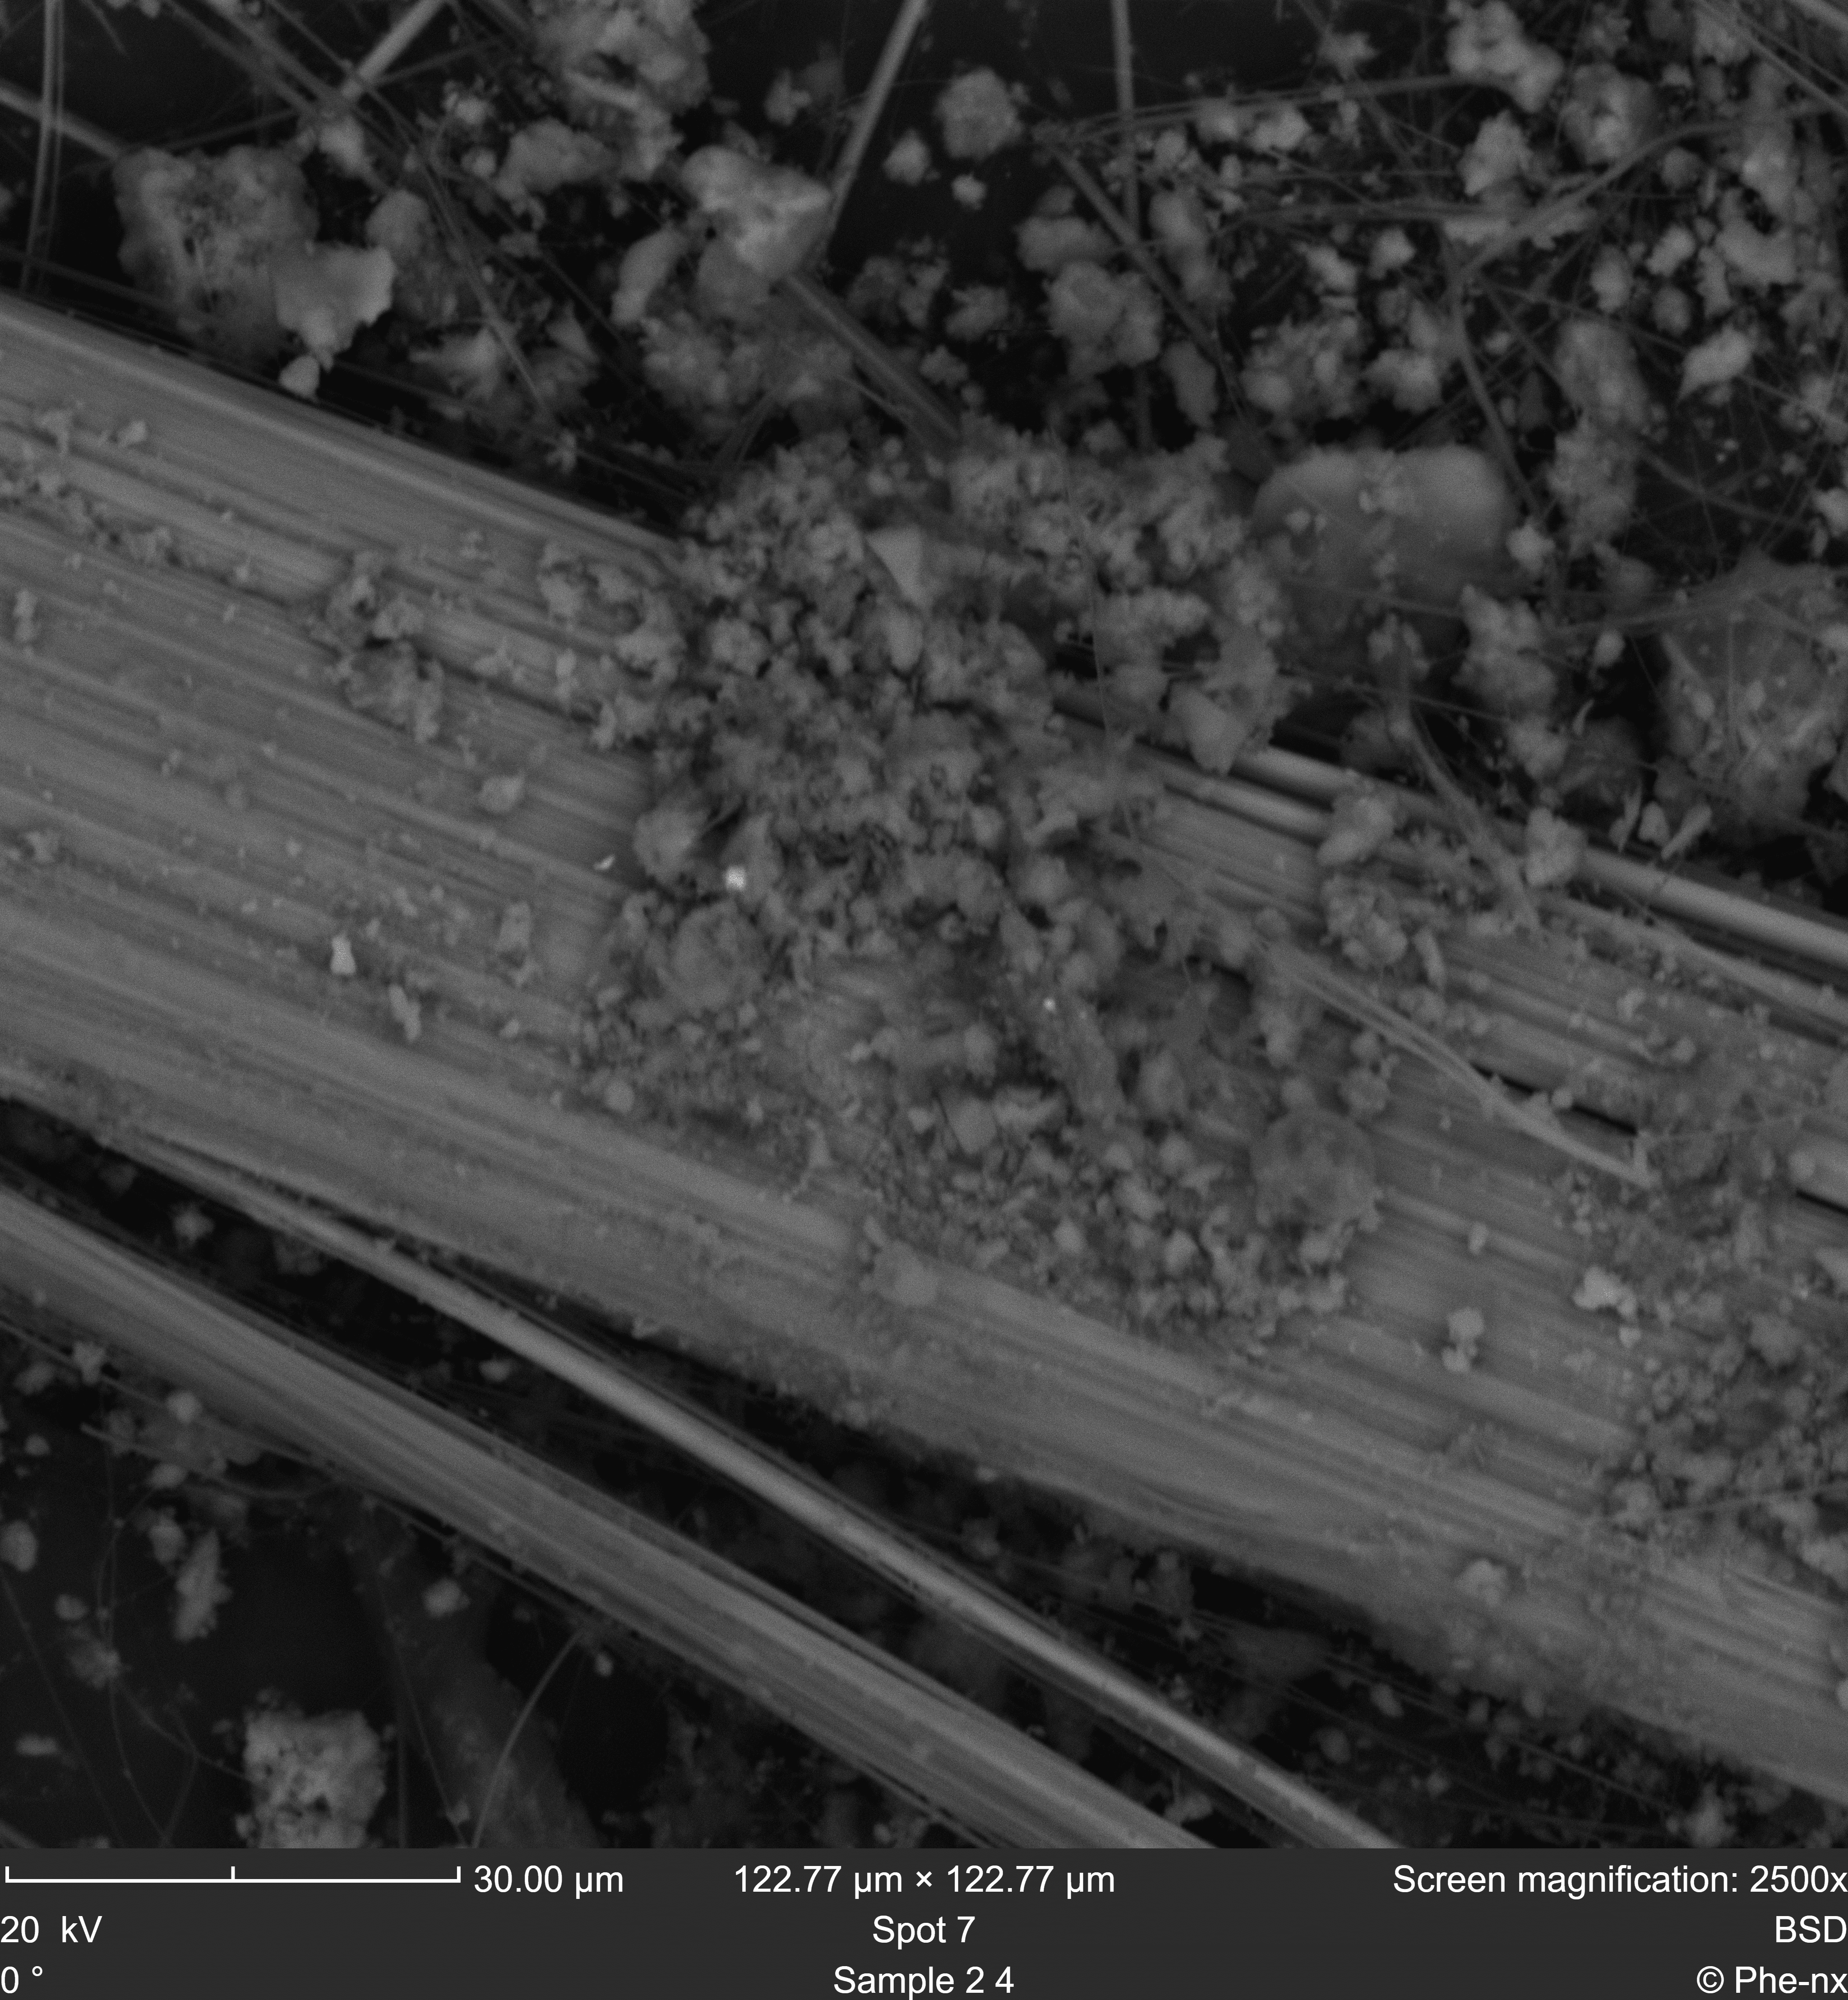
Figure 3 – BSD image of asbestos fibers in a fiber cement sample 
Figure 4 – EDS map of asbestos fibers in the fiber cement sample. Chrysotile and crocidolite fibers can be clearly distinguished based on their composition: chrysotile fibers contain magnesium (red) while crocidolite fibers contain iron (green). The calcium-based cement matrix is colored blue.
The seamless integration of SEM imaging and EDS mapping in modern bench-top SEM allows for faster analysis of samples containing even a small amount of asbestos fibers. Since asbestos is widely used in insulating materials, the ability to work with non-conductive samples is essential to operate in this field. The Semplor NANOS TT-SEM provides both low vacuum mode and advanced BSE detector to obtain sharper images of conductive and non-conductive samples at any voltage setting, at 10 kV for more sensitive surface imaging or at 20 kV for the best resolution and EDS analysis. Counting asbestos fibers after they have been identified becomes easy due to the high contrast between the fibers and the rest of the sample, guided by the EDS maps providing the necessary mineral identification information.

Figure 5 – Asbestos fibers and non-fibrous impurities mixed in insulating rubber. The BSD image shows mineral residues on the surface.

Figure 6 – The mineral residues on the surface identified by this EDS map: both fibrous and non-fibrous magnesium silicate (Mg: red, Si: green, magnesium silicate: yellow) were detected interspersed in the rubber matrix (blue).